LibMini
QTViewer Usage Example
← Usage | ● | Navigation →
A simple usage example in 5 steps - we produce and visualize a 3D tileset for the Island of Oahu, Hawai’i, by resampling a dem and a color layer:
- We assume that we have the libGrid data directory available.
- Step 1) Drag the “Oahu-10.tif” dem layer from the “elev” directory into the qtviewer.
- Step 2) Drag the “Oahu-25.tif” color layer from the “imag” directory into the qtviewer.
- Step 3) Right click at the list view and choose “resample all” from the context menu.
- Step 4) Wait several minutes while the resampling takes place.
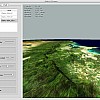
- Step 5) Then zoom into the produced tileset with the middle mouse wheel to see some 3D details.
If this takes too long for you impatient guys, we can do the same with a small island off the east coast of Oahu, Manana Island, for a total of just 3 simple steps:
- We assume that we have the libGrid data directory available.
- Step 1) Drag the “MananaIsland.tif” dem layer from the “elev/Oahu-Islands” directory into the qtviewer.
- Step 2) Right click at the list view and choose “resample all” from the context menu.
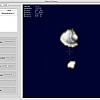
- Step 3) Zoom into Manana Island to see some 3D details.
← Usage | ● | Navigation →


